EXHIBIT 99.2
Published on February 18, 2026
Exhibit 99.2
| Earnings Presentation FOURTH QUARTER 2025 |

| 2 Q3 2022 Financial Snapshot Forward-looking statements When used in this presentation or other written or oral communications, statements that are not historical in nature, including those containing words such as “will,” “believe,” “expect,” “anticipate,” “estimate,” “plan,” “continue,” “intend,” “should,” “could,” “would,” “may,” the negative of these words or similar expressions, are intended to identify “forward-looking statements” within the meaning of Section 27A of the Securities Act of 1933, as amended, and Section 21E of the Securities Exchange Act of 1934, as amended, and, as such, may involve known and unknown risks, uncertainties and assumptions. These forward-looking statements include information about possible or assumed future results with respect to MFA’s business, financial condition, liquidity, results of operations, plans and objectives. Among the important factors that could cause our actual results to differ materially from those projected in any forward-looking statements that we make are: general economic developments and trends, including the current tensions in international trade, a potential prolonged U.S. government shutdown and the performance of the labor, housing, real estate, mortgage finance and broader financial markets; inflation, increases in interest rates and changes in the market (i.e., fair) value of MFA’s residential whole loans, MBS, securitized debt and other assets, as well as changes in the value of MFA’s liabilities accounted for at fair value through earnings; the effectiveness of hedging transactions; changes in the prepayment rates on residential mortgage assets, an increase of which could result in a reduction of the yield on certain investments in its portfolio and could require MFA to reinvest the proceeds received by it as a result of such prepayments in investments with lower coupons, while a decrease in which could result in an increase in the interest rate duration of certain investments in MFA’s portfolio making their valuation more sensitive to changes in interest rates and could result in lower forecasted cash flows; credit risks underlying MFA’s assets, including changes in the default rates and management’s assumptions regarding default rates and loss severities on the mortgage loans in MFA’s residential whole loan portfolio; MFA’s ability to borrow to finance its assets and the terms, including the cost, maturity and other terms, of any such borrowings; implementation of or changes in government regulations or programs affecting MFA’s business (including as a result of the current U.S. administration); MFA’s estimates regarding taxable income, the actual amount of which is dependent on a number of factors, including, but not limited to, changes in the amount of interest income and financing costs, the method elected by MFA to accrete the market discount on residential whole loans and the extent of prepayments, realized losses and changes in the composition of MFA’s residential whole loan portfolios that may occur during the applicable tax period, including gain or loss on any MBS disposals or whole loan modifications, foreclosures and liquidations; the timing and amount of distributions to stockholders, which are declared and paid at the discretion of MFA’s Board of Directors and will depend on, among other things, MFA’s taxable income, its financial results and overall financial condition and liquidity, maintenance of its REIT qualification and such other factors as MFA’s Board of Directors deems relevant; MFA’s ability to maintain its qualification as a REIT for federal income tax purposes; MFA’s ability to maintain its exemption from registration under the Investment Company Act of 1940, as amended (or the “Investment Company Act”), including statements regarding the concept release issued by the Securities and Exchange Commission (“SEC”) relating to interpretive issues under the Investment Company Act with respect to the status under the Investment Company Act of certain companies that are engaged in the business of acquiring mortgages and mortgage-related interests; MFA’s ability to continue growing its residential whole loan portfolio, which is dependent on, among other things, the supply of loans offered for sale in the market; targeted or expected returns on our investments in recently-originated mortgage loans, the performance of which is, similar to our other mortgage loan investments, subject to, among other things, differences in prepayment risk, credit risk and financing costs associated with such investments; risks associated with the ongoing operation of Lima One Holdings, LLC (including, without limitation, industry competition, unanticipated expenditures relating to or liabilities arising from its operation (including, among other things, a failure to realize management’s assumptions regarding expected growth in business purpose loan (BPL) origination volumes and credit risks underlying BPLs, including changes in the default rates and management’s assumptions regarding default rates and loss severities on the BPLs originated by Lima One); expected returns on MFA’s investments in nonperforming residential whole loans (“NPLs”), which are affected by, among other things, the length of time required to foreclose upon, sell, liquidate or otherwise reach a resolution of the property underlying the NPL, home price values, amounts advanced to carry the asset (e.g., taxes, insurance, maintenance expenses, etc. on the underlying property) and the amount ultimately realized upon resolution of the asset; risks associated with our investments in loan originators; risks associated with investing in real estate assets generally, including changes in business conditions and the general economy; and other risks, uncertainties and factors, including those described in the annual, quarterly and current reports that we file with the SEC. These forward-looking statements are based on beliefs, assumptions and expectations of MFA’s future performance, taking into account information currently available. Readers and listeners are cautioned not to place undue reliance on these forward-looking statements, which speak only as of the date on which they are made. New risks and uncertainties arise over time and it is not possible to predict those events or how they may affect MFA. Except as required by law, MFA is not obligated to, and does not intend to, update or revise any forward-looking statements, whether as a result of new information, future events or otherwise. |
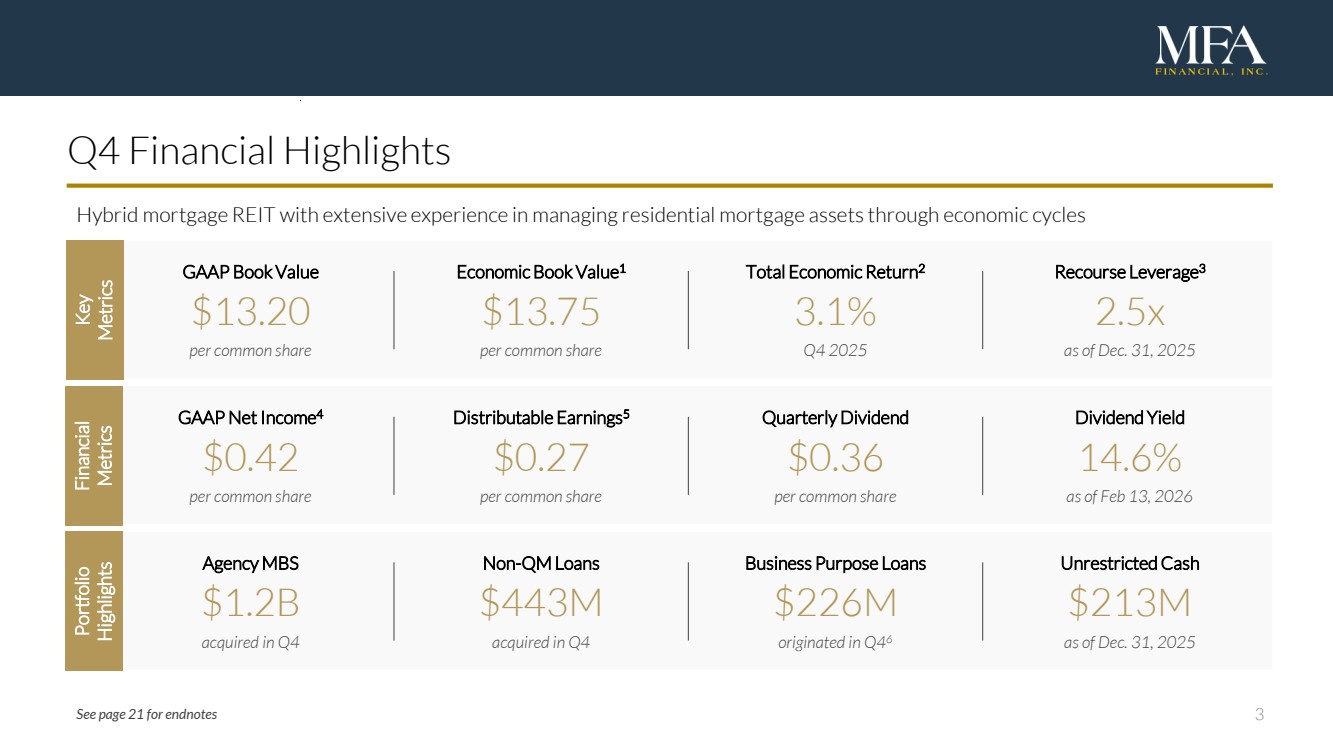
| 3 Q3 2022 Financial Snapshot Hybrid mortgage REIT with extensive experience in managing residential mortgage assets through economic cycles See page 21 for endnotes Q4 Financial Highlights GAAP Book Value $13.20 per common share Economic Book Value1 $13.75 per common share Total Economic Return2 3.1% Q4 2025 Recourse Leverage3 2.5x as of Dec. 31, 2025 Key Metrics GAAP Net Income4 $0.42 per common share Distributable Earnings5 $0.27 per common share Quarterly Dividend $0.36 per common share Dividend Yield 14.6% as of Feb 13, 2026 Financial Metrics Agency MBS $1.2B acquired in Q4 Non-QM Loans $443M acquired in Q4 Business Purpose Loans $226M originated in Q46 Unrestricted Cash $213M as of Dec. 31, 2025 Portfolio Highlights |
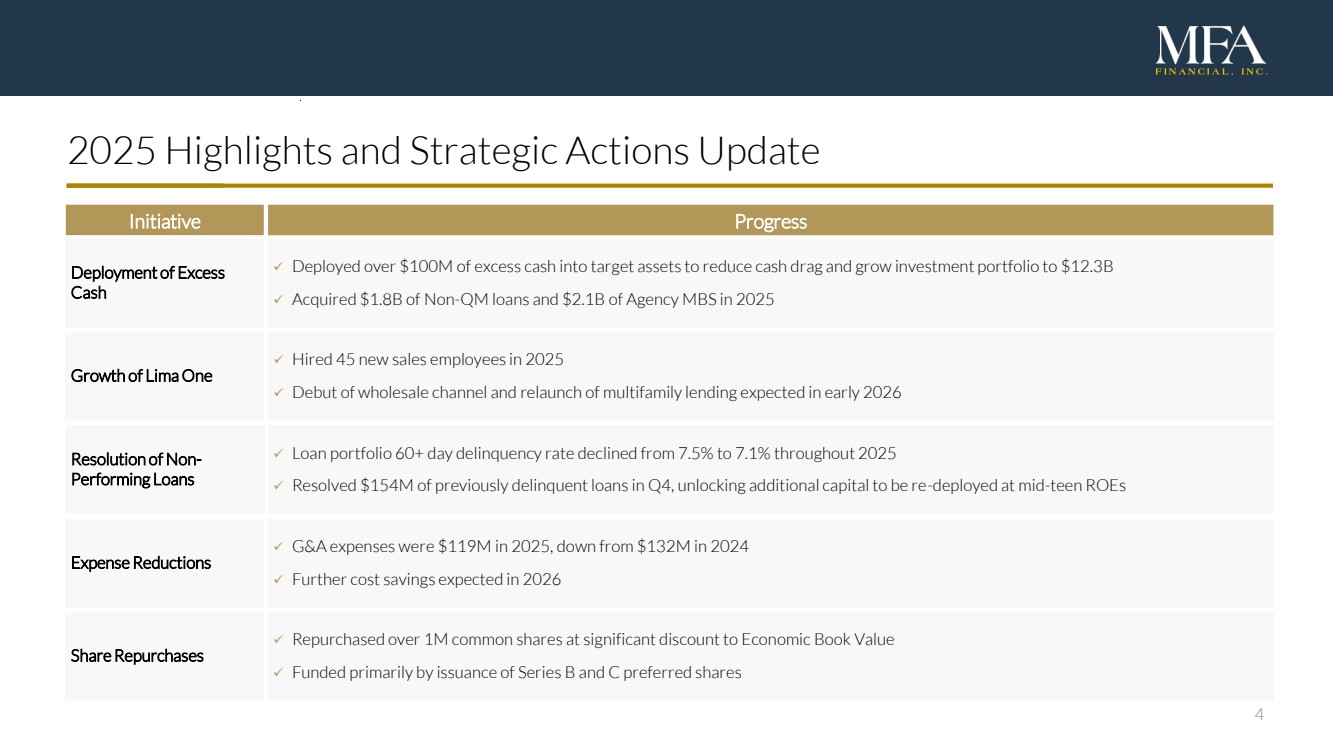
| 4 2025 Highlights and Strategic Actions Update Initiative Deployment of Excess Cash ✓ Loan portfolio 60+ day delinquency rate declined from 7.5% to 7.1% throughout 2025 ✓ Resolved $154M of previously delinquent loans in Q4, unlocking additional capital to be re-deployed at mid-teen ROEs ✓ G&A expenses were $119M in 2025, down from $132M in 2024 ✓ Further cost savings expected in 2026 ✓ Repurchased over 1M common shares at significant discount to Economic Book Value ✓ Funded primarily by issuance of Series B and C preferred shares ✓ Hired 45 new sales employees in 2025 ✓ Debut of wholesale channel and relaunch of multifamily lending expected in early 2026 Progress Growth of Lima One Resolution of Non-Performing Loans Expense Reductions ✓ Deployed over $100M of excess cash into target assets to reduce cash drag and grow investment portfolio to $12.3B ✓ Acquired $1.8B of Non-QM loans and $2.1B of Agency MBS in 2025 Share Repurchases |
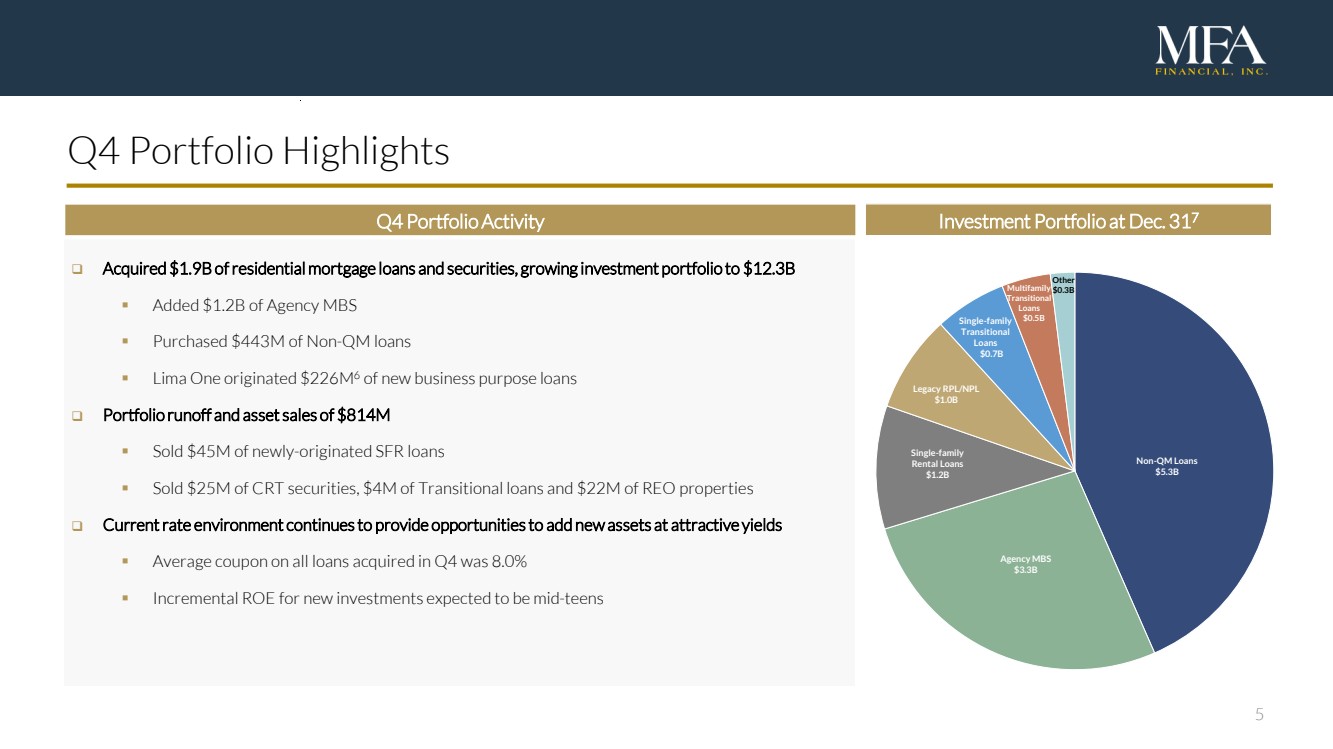
| 5 ❑ Acquired $1.9B of residential mortgage loans and securities, growing investment portfolio to $12.3B ▪ Added $1.2B of Agency MBS ▪ Purchased $443M of Non-QM loans ▪ Lima One originated $226M6 of new business purpose loans ❑ Portfolio runoff and asset sales of $814M ▪ Sold $45M of newly-originated SFR loans ▪ Sold $25M of CRT securities, $4M of Transitional loans and $22M of REO properties ❑ Current rate environment continues to provide opportunities to add new assets at attractive yields ▪ Average coupon on all loans acquired in Q4 was 8.0% ▪ Incremental ROE for new investments expected to be mid-teens Q Q4 Portfolio Highlights Investment Portfolio at Dec. 31 Q4 Portfolio Activity 7 Non-QM Loans $5.3B Agency MBS $3.3B Other Multifamily $0.3B Transitional Loans $0.5B Single-family Transitional Loans $0.7B Single-family Rental Loans $1.2B Legacy RPL/NPL $1.0B |
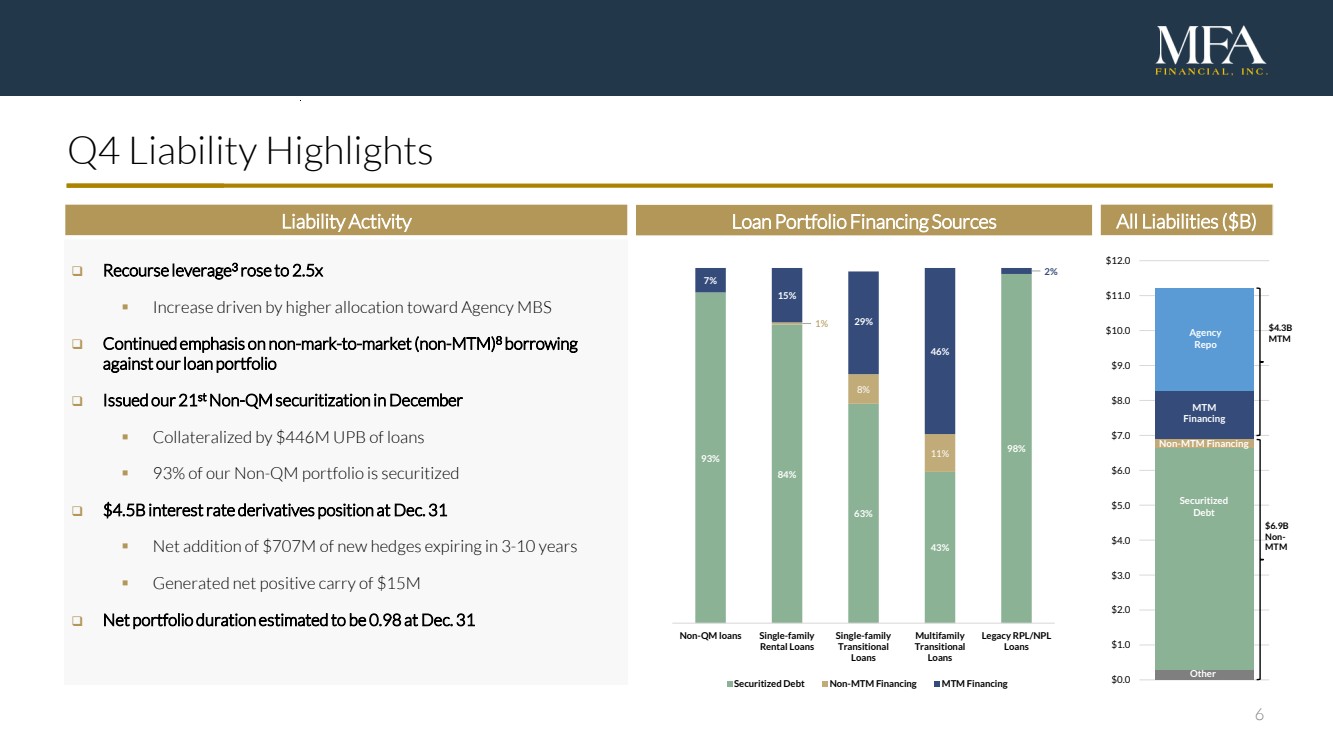
| 6 $0.0 $1.0 $2.0 $3.0 $4.0 $5.0 $6.0 $7.0 $8.0 $9.0 $10.0 $11.0 $12.0 Agency Repo MTM Financing Non-MTM Financing Securitized Debt Other 93% 84% 63% 43% 98% 1% 8% 11% 7% 15% 29% 46% 2% Non-QM loans Single-family Rental Loans Single-family Transitional Loans Multifamily Transitional Loans Legacy RPL/NPL Loans Securitized Debt Non-MTM Financing MTM Financing ❑ Recourse leverage3 rose to 2.5x ▪ Increase driven by higher allocation toward Agency MBS ❑ Continued emphasis on non-mark-to-market (non-MTM)8 borrowing against our loan portfolio ❑ Issued our 21st Non-QM securitization in December ▪ Collateralized by $446M UPB of loans ▪ 93% of our Non-QM portfolio is securitized ❑ $4.5B interest rate derivatives position at Dec. 31 ▪ Net addition of $707M of new hedges expiring in 3-10 years ▪ Generated net positive carry of $15M ❑ Net portfolio duration estimated to be 0.98 at Dec. 31 Q4 Liability Highlights Liability Activity Loan Portfolio Financing Sources $6.9B Non-MTM All Liabilities ($B) $4.3B MTM |
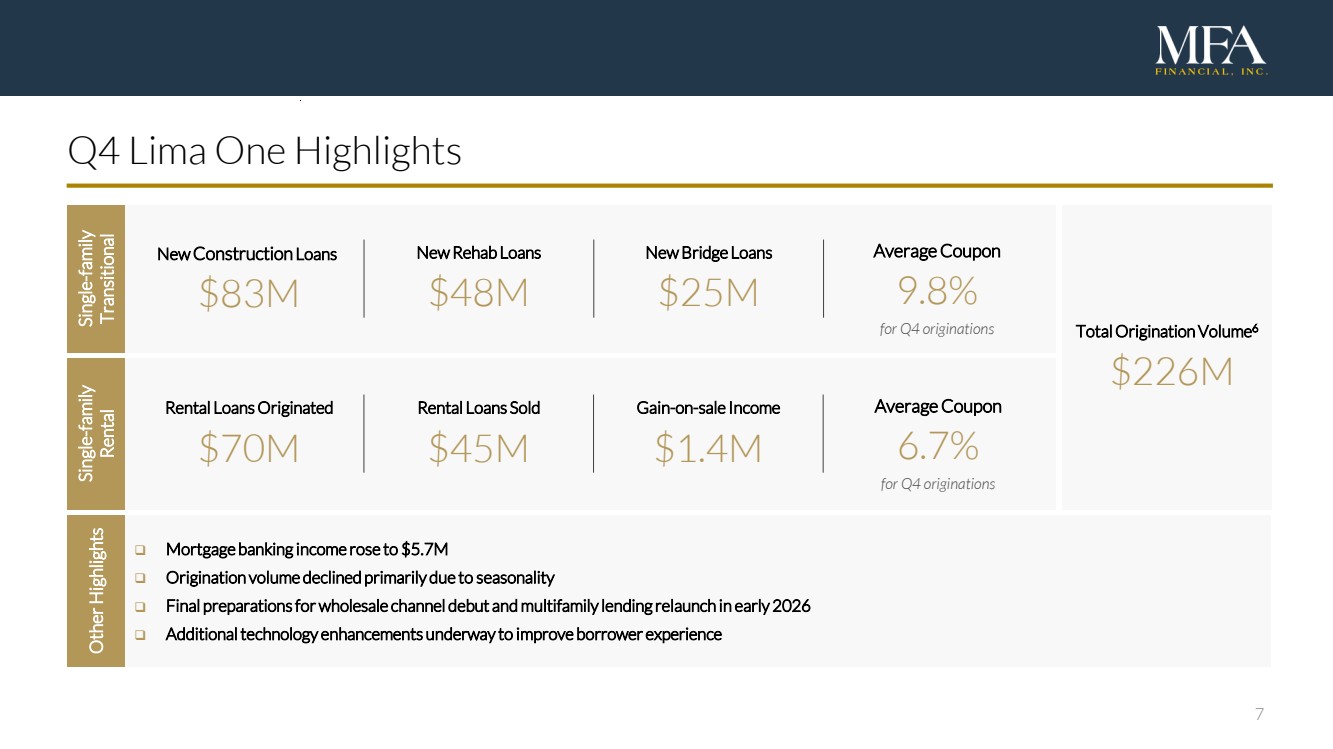
| 7 Single-family Rental Gain-on-sale Income $1.4M Single-family Transitional New Bridge Loans $25M Q3 2022 Financial Snapshot Q4 Lima One Highlights New Rehab Loans $48M New Construction Loans $83M Total Origination Volume6 $226M Rental Loans Sold $45M Rental Loans Originated $70M ❑ Mortgage banking income rose to $5.7M ❑ Origination volume declined primarily due to seasonality ❑ Final preparations for wholesale channel debut and multifamily lending relaunch in early 2026 ❑ Additional technology enhancements underway to improve borrower experience Other Highlights Average Coupon 9.8% for Q4 originations Average Coupon 6.7% for Q4 originations |
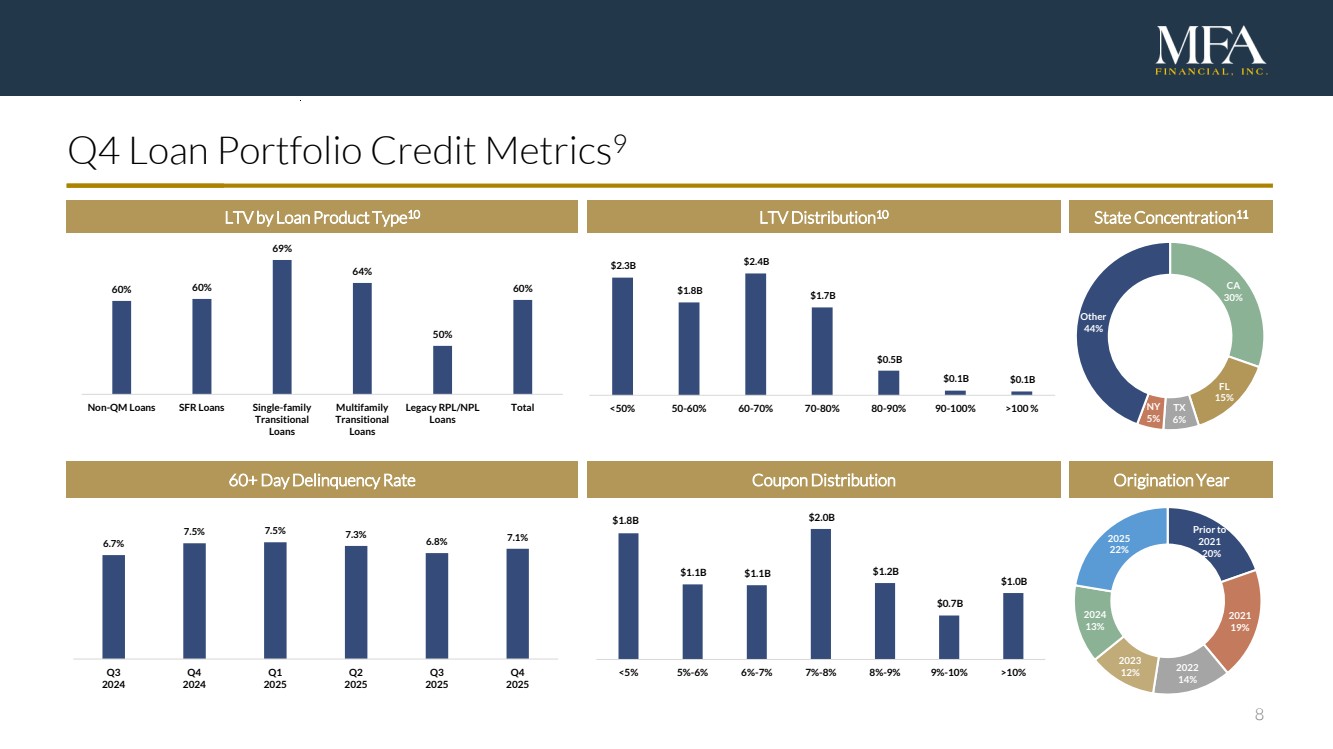
| 8 $2.3B $1.8B $2.4B $1.7B $0.5B $0.1B $0.1B <50% 50-60% 60-70% 70-80% 80-90% 90-100% >100 % CA 30% FL 15% TX 6% NY 5% Other 44% Q3 2022 Financial Snapshot Q4 Loan Portfolio Credit Metrics9 60% 60% 69% 64% 50% 60% Non-QM Loans SFR Loans Single-family Transitional Loans Multifamily Transitional Loans Legacy RPL/NPL Loans Total LTV by Loan Product Type10 LTV Distribution10 State Concentration11 60+ Day Delinquency Rate Coupon Distribution Origination Year 6.7% 7.5% 7.5% 7.3% 6.8% 7.1% Q3 2024 Q4 2024 Q1 2025 Q2 2025 Q3 2025 Q4 2025 $1.8B $1.1B $1.1B $2.0B $1.2B $0.7B $1.0B <5% 5%-6% 6%-7% 7%-8% 8%-9% 9%-10% >10% Prior to 2021 20% 2021 19% 2022 14% 2023 12% 2024 13% 2025 22% |
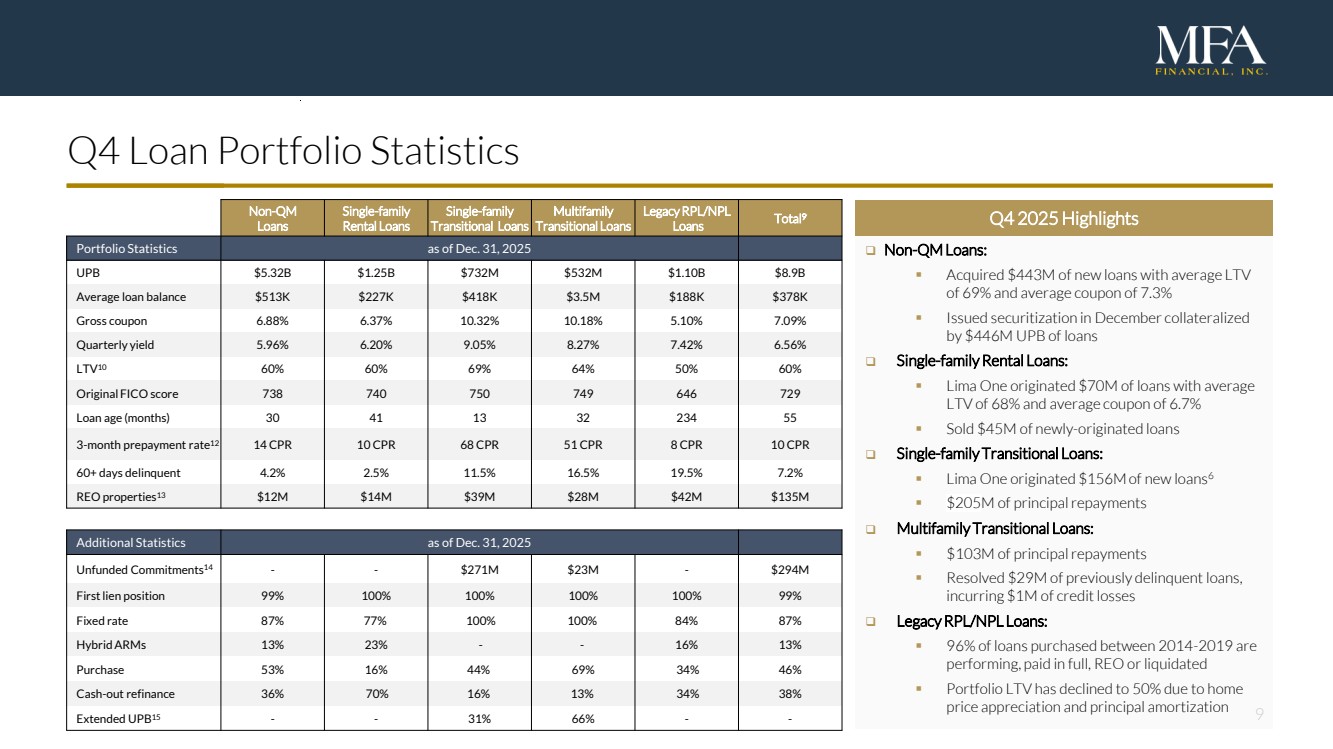
| 9 Q3 2022 Financial Snapshot Q4 Loan Portfolio Statistics Non-QM Loans Single-family Rental Loans Single-family Transitional Loans Multifamily Transitional Loans Legacy RPL/NPL Loans Total9 Portfolio Statistics as of Dec. 31, 2025 UPB $5.32B $1.25B $732M $532M $1.10B $8.9B Average loan balance $513K $227K $418K $3.5M $188K $378K Gross coupon 6.88% 6.37% 10.32% 10.18% 5.10% 7.09% Quarterly yield 5.96% 6.20% 9.05% 8.27% 7.42% 6.56% LTV10 60% 60% 69% 64% 50% 60% Original FICO score 738 740 750 749 646 729 Loan age (months) 30 41 13 32 234 55 3-month prepayment rate12 14 CPR 10 CPR 68 CPR 51 CPR 8 CPR 10 CPR 60+ days delinquent 4.2% 2.5% 11.5% 16.5% 19.5% 7.2% REO properties13 $12M $14M $39M $28M $42M $135M Additional Statistics as of Dec. 31, 2025 Unfunded Commitments14 - - $271M $23M - $294M First lien position 99% 100% 100% 100% 100% 99% Fixed rate 87% 77% 100% 100% 84% 87% Hybrid ARMs 13% 23% - - 16% 13% Purchase 53% 16% 44% 69% 34% 46% Cash-out refinance 36% 70% 16% 13% 34% 38% Extended UPB15 - - 31% 66% - - ❑ Non-QM Loans: ▪ Acquired $443M of new loans with average LTV of 69% and average coupon of 7.3% ▪ Issued securitization in December collateralized by $446M UPB of loans ❑ Single-family Rental Loans: ▪ Lima One originated $70M of loans with average LTV of 68% and average coupon of 6.7% ▪ Sold $45M of newly-originated loans ❑ Single-family Transitional Loans: ▪ Lima One originated $156Mof new loans6 ▪ $205M of principal repayments ❑ Multifamily Transitional Loans: ▪ $103M of principalrepayments ▪ Resolved $29M of previously delinquent loans, incurring $1M of credit losses ❑ Legacy RPL/NPL Loans: ▪ 96% of loans purchased between 2014-2019 are performing, paid in full, REO or liquidated ▪ Portfolio LTV has declined to 50% due to home price appreciation and principal amortization Q4 2025 Highlights |
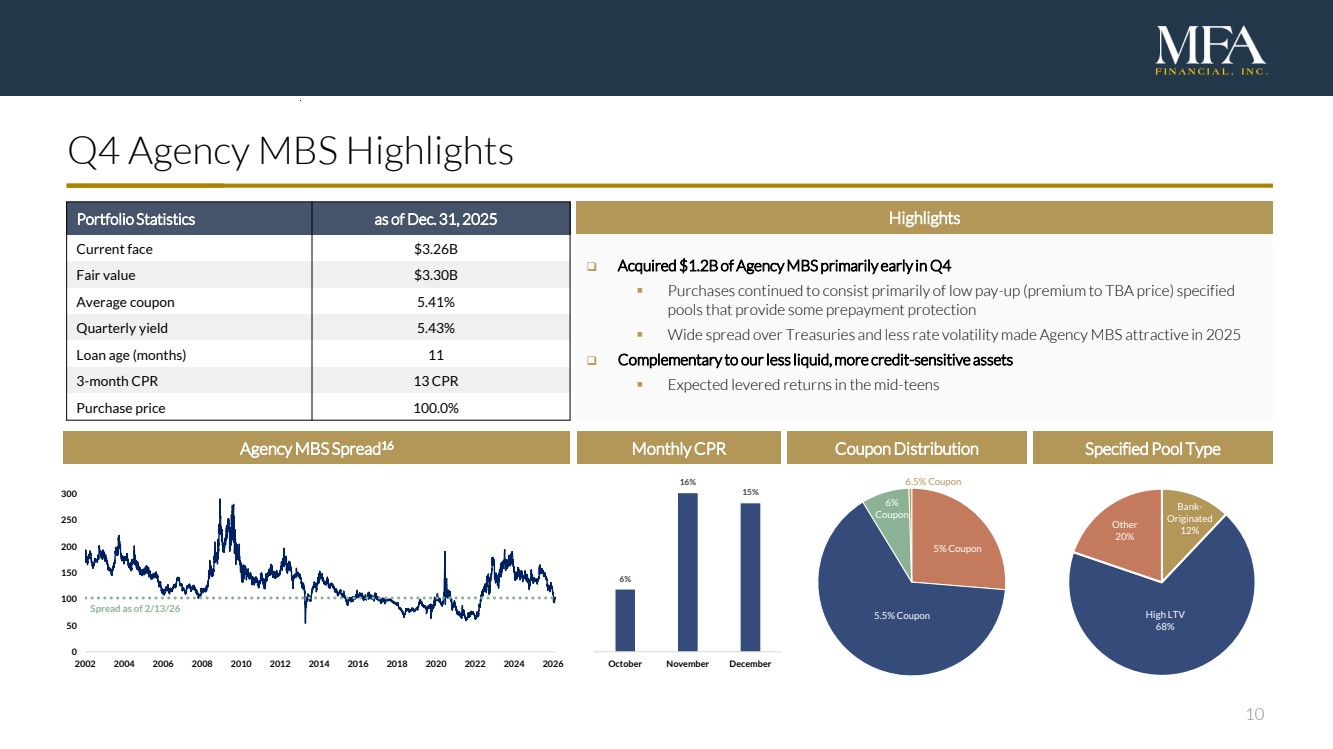
| 10 5% Coupon 5.5% Coupon 6% Coupon 6.5% Coupon Q3 2022 Financial Snapshot Q4 Agency MBS Highlights ❑ Acquired $1.2B of Agency MBS primarily early in Q4 ▪ Purchases continued to consist primarily of low pay-up (premium to TBA price) specified pools that provide some prepayment protection ▪ Wide spread over Treasuries and less rate volatility made Agency MBS attractive in 2025 ❑ Complementary to our less liquid, more credit-sensitive assets ▪ Expected levered returns in the mid-teens Portfolio Statistics as of Dec. 31, 2025 Highlights Current face $3.26B Fair value $3.30B Average coupon 5.41% Quarterly yield 5.43% Loan age (months) 11 3-month CPR 13 CPR Purchase price 100.0% Agency MBS Spread16 Monthly CPR Coupon Distribution Specified Pool Type Bank-Originated 12% High LTV 68% Other 20% 0 50 100 150 200 250 300 2002 2004 2006 2008 2010 2012 2014 2016 2018 2020 2022 2024 2026 Spread as of 2/13/26 6% 16% 15% October November December |
| 11 Appendix James Casebere, Landscape with Houses (Dutchess County, NY) #2, 2010 (detail) |

| 12 MFA Overview ❑ MFA Financial, Inc. (NYSE: MFA) is an internally managed real estate investment trust (REIT) that invests in U.S. residential mortgage loans and mortgage-backed securities ❑ MFA focuses primarily on mortgage subsectors in which it tries to avoid direct competition with banks and government-sponsored enterprises ❑ MFA owns and actively manages a diversified portfolio of non-qualified mortgage (Non-QM) loans, business purpose loans (BPLs), re-performing/non-performing loans (Legacy RPL/NPLs) and agency mortgage-backed securities (MBS) ❑ In 2021, MFA acquired Lima One Capital, a leading nationwide BPL originator and servicer with over $11B6 in originations since its formation in 2010 ❑ MFA originates BPLs directly through Lima One and acquires Non-QM loans through flow and mini-bulk arrangements with a select group of originators with which it holds strong relationships ❑ MFA operates a leading residential credit securitization platform with over $12B of issuance since inception ❑ MFA has deep expertise in residential credit as well as a long history of investing in new asset classes when compelling opportunities arise ❑ Since its IPO in 1998, MFA has distributed over $5B of dividends to its stockholders |
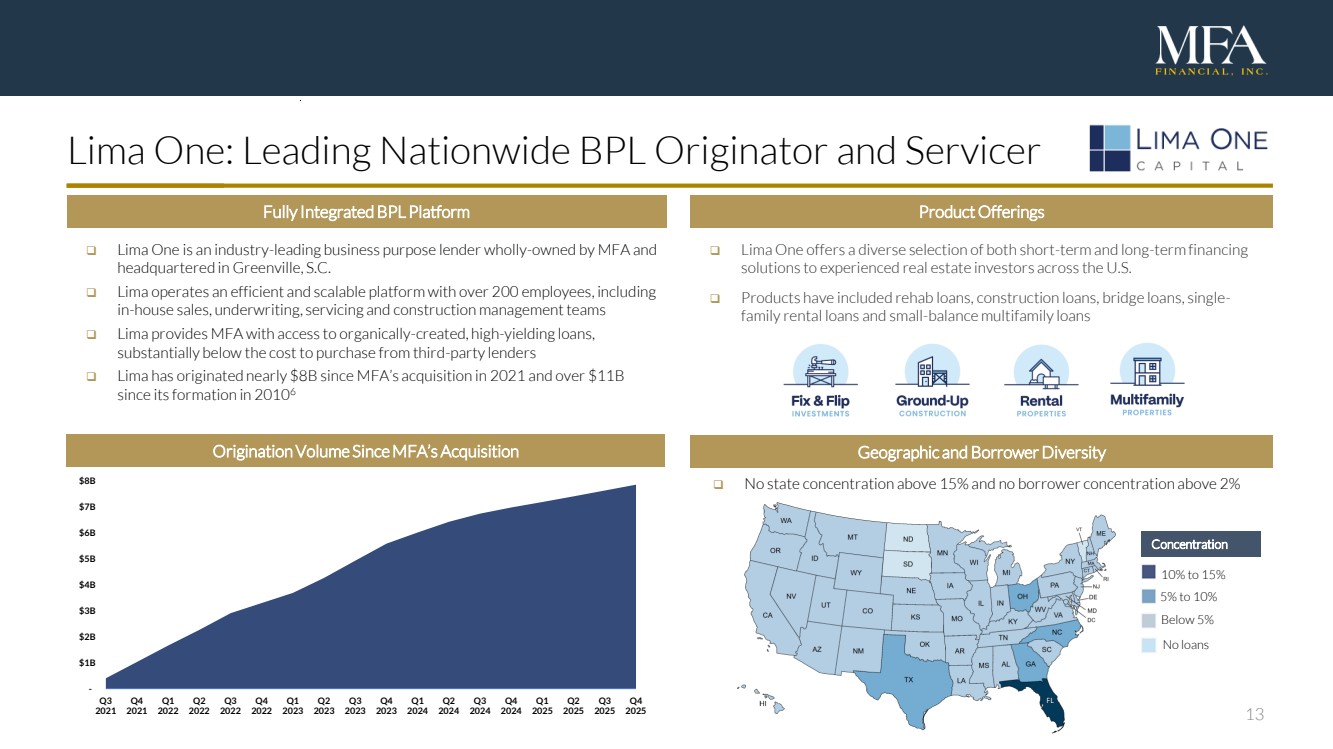
| 13 ❑ No state concentration above 15% and no borrower concentration above 2% ❑ Lima One is an industry-leading business purpose lender wholly-owned by MFA and headquartered in Greenville, S.C. ❑ Lima operates an efficient and scalable platform with over 200 employees, including in-house sales, underwriting, servicing and construction management teams ❑ Lima provides MFA with access to organically-created, high-yielding loans, substantially below the cost to purchase from third-party lenders ❑ Lima has originated nearly $8B since MFA’s acquisition in 2021 and over $11B since its formation in 20106 Lima One: Leading Nationwide BPL Originator and Servicer Fully Integrated BPL Platform ❑ Lima One offers a diverse selection of both short-term and long-term financing solutions to experienced real estate investors across the U.S. ❑ Products have included rehab loans, construction loans, bridge loans, single-family rental loans and small-balance multifamily loans Product Offerings Origination Volume Since MFA’s Acquisition Geographic and Borrower Diversity Concentration 10% to 15% 5% to 10% Below 5% No loans - $1B $2B $3B $4B $5B $6B $7B $8B Q3 2021 Q4 2021 Q1 2022 Q2 2022 Q3 2022 Q4 2022 Q1 2023 Q2 2023 Q3 2023 Q4 2023 Q1 2024 Q2 2024 Q3 2024 Q4 2024 Q1 2025 Q2 2025 Q3 2025 Q4 2025 FL |
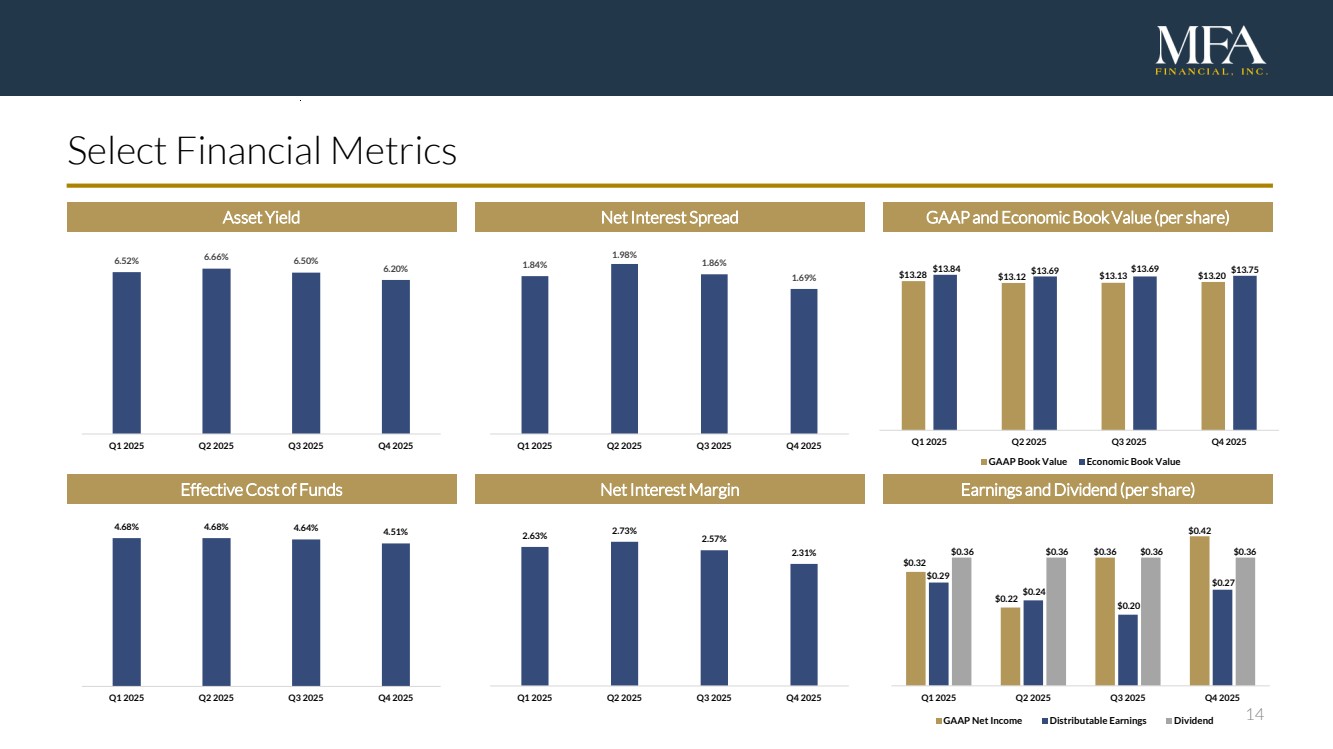
| 14 Select Financial Metrics Asset Yield Net Interest Spread GAAP and Economic Book Value (per share) Effective Cost of Funds Net Interest Margin Earnings and Dividend (per share) 1.84% 1.98% 1.86% 1.69% Q1 2025 Q2 2025 Q3 2025 Q4 2025 6.52% 6.66% 6.50% 6.20% Q1 2025 Q2 2025 Q3 2025 Q4 2025 4.68% 4.68% 4.64% 4.51% Q1 2025 Q2 2025 Q3 2025 Q4 2025 2.63% 2.73% 2.57% 2.31% Q1 2025 Q2 2025 Q3 2025 Q4 2025 $13.28 $13.12 $13.13 $13.20 $13.84 $13.69 $13.69 $13.75 Q1 2025 Q2 2025 Q3 2025 Q4 2025 GAAP Book Value Economic Book Value $0.32 $0.22 $0.36 $0.42 $0.29 $0.24 $0.20 $0.27 $0.36 $0.36 $0.36 $0.36 Q1 2025 Q2 2025 Q3 2025 Q4 2025 GAAP Net Income Distributable Earnings Dividend |
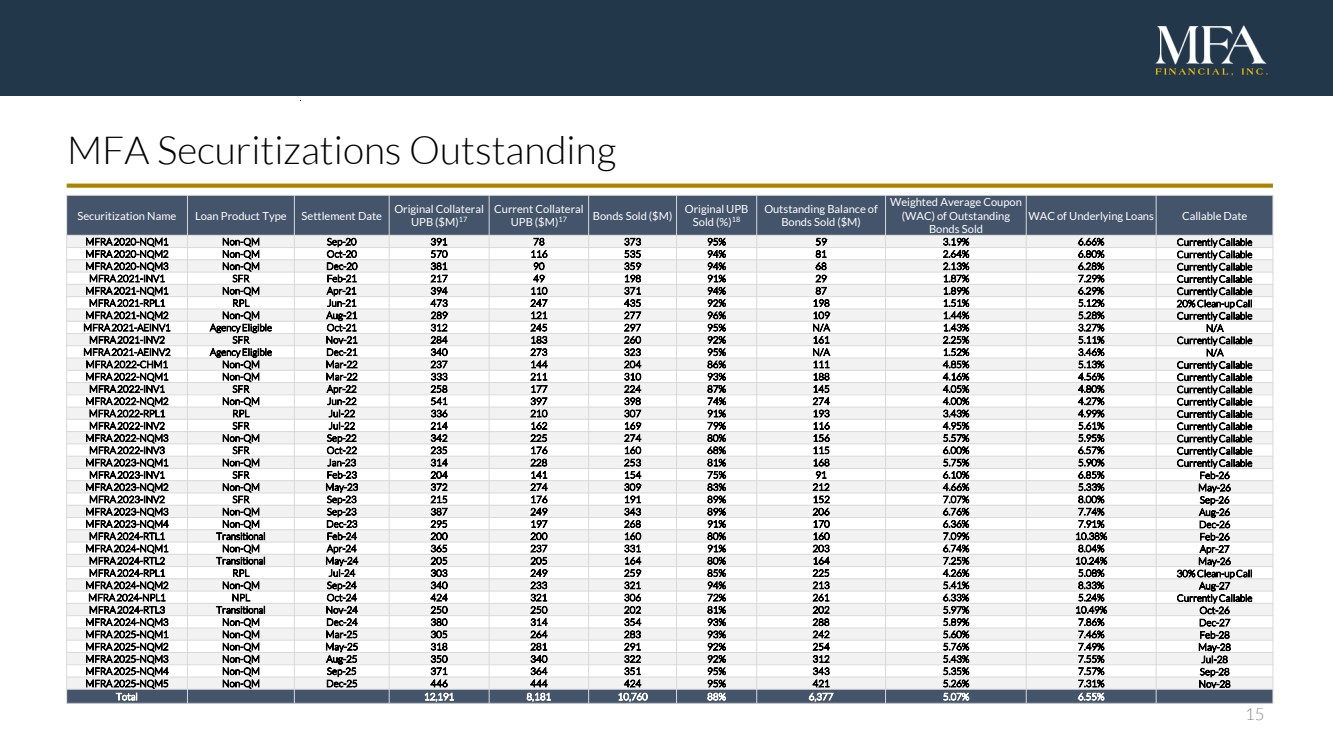
| 15 MFA Securitizations Outstanding Securitization Name Loan Product Type Settlement Date Original Collateral UPB ($M)17 Current Collateral UPB ($M)17 Bonds Sold ($M) Original UPB Sold (%)18 Outstanding Balance of Bonds Sold ($M) Weighted Average Coupon (WAC) of Outstanding Bonds Sold WAC of Underlying Loans Callable Date MFRA 2020-NQM1 Non-QM Sep-20 391 78 373 95% 59 3.19% 6.66% Currently Callable MFRA 2020-NQM2 Non-QM Oct-20 570 116 535 94% 81 2.64% 6.80% Currently Callable MFRA 2020-NQM3 Non-QM Dec-20 381 90 359 94% 68 2.13% 6.28% Currently Callable MFRA 2021-INV1 SFR Feb-21 217 49 198 91% 29 1.87% 7.29% Currently Callable MFRA 2021-NQM1 Non-QM Apr-21 394 110 371 94% 87 1.89% 6.29% Currently Callable MFRA 2021-RPL1 RPL Jun-21 473 247 435 92% 198 1.51% 5.12% 20% Clean-up Call MFRA 2021-NQM2 Non-QM Aug-21 289 121 277 96% 109 1.44% 5.28% Currently Callable MFRA 2021-AEINV1 Agency Eligible Oct-21 312 245 297 95% N/A 1.43% 3.27% N/A MFRA 2021-INV2 SFR Nov-21 284 183 260 92% 161 2.25% 5.11% Currently Callable MFRA 2021-AEINV2 Agency Eligible Dec-21 340 273 323 95% N/A 1.52% 3.46% N/A MFRA 2022-CHM1 Non-QM Mar-22 237 144 204 86% 111 4.85% 5.13% Currently Callable MFRA 2022-NQM1 Non-QM Mar-22 333 211 310 93% 188 4.16% 4.56% Currently Callable MFRA 2022-INV1 SFR Apr-22 258 177 224 87% 145 4.05% 4.80% Currently Callable MFRA 2022-NQM2 Non-QM Jun-22 541 397 398 74% 274 4.00% 4.27% Currently Callable MFRA 2022-RPL1 RPL Jul-22 336 210 307 91% 193 3.43% 4.99% Currently Callable MFRA 2022-INV2 SFR Jul-22 214 162 169 79% 116 4.95% 5.61% Currently Callable MFRA 2022-NQM3 Non-QM Sep-22 342 225 274 80% 156 5.57% 5.95% Currently Callable MFRA 2022-INV3 SFR Oct-22 235 176 160 68% 115 6.00% 6.57% Currently Callable MFRA 2023-NQM1 Non-QM Jan-23 314 228 253 81% 168 5.75% 5.90% Currently Callable MFRA 2023-INV1 SFR Feb-23 204 141 154 75% 91 6.10% 6.85% Feb-26 MFRA 2023-NQM2 Non-QM May-23 372 274 309 83% 212 4.66% 5.33% May-26 MFRA 2023-INV2 SFR Sep-23 215 176 191 89% 152 7.07% 8.00% Sep-26 MFRA 2023-NQM3 Non-QM Sep-23 387 249 343 89% 206 6.76% 7.74% Aug-26 MFRA 2023-NQM4 Non-QM Dec-23 295 197 268 91% 170 6.36% 7.91% Dec-26 MFRA 2024-RTL1 Transitional Feb-24 200 200 160 80% 160 7.09% 10.38% Feb-26 MFRA 2024-NQM1 Non-QM Apr-24 365 237 331 91% 203 6.74% 8.04% Apr-27 MFRA 2024-RTL2 Transitional May-24 205 205 164 80% 164 7.25% 10.24% May-26 MFRA 2024-RPL1 RPL Jul-24 303 249 259 85% 225 4.26% 5.08% 30% Clean-up Call MFRA 2024-NQM2 Non-QM Sep-24 340 233 321 94% 213 5.41% 8.33% Aug-27 MFRA 2024-NPL1 NPL Oct-24 424 321 306 72% 261 6.33% 5.24% Currently Callable MFRA 2024-RTL3 Transitional Nov-24 250 250 202 81% 202 5.97% 10.49% Oct-26 MFRA 2024-NQM3 Non-QM Dec-24 380 314 354 93% 288 5.89% 7.86% Dec-27 MFRA 2025-NQM1 Non-QM Mar-25 305 264 283 93% 242 5.60% 7.46% Feb-28 MFRA 2025-NQM2 Non-QM May-25 318 281 291 92% 254 5.76% 7.49% May-28 MFRA 2025-NQM3 Non-QM Aug-25 350 340 322 92% 312 5.43% 7.55% Jul-28 MFRA 2025-NQM4 Non-QM Sep-25 371 364 351 95% 343 5.35% 7.57% Sep-28 MFRA 2025-NQM5 Non-QM Dec-25 446 444 424 95% 421 5.26% 7.31% Nov-28 Total 12,191 8,181 10,760 88% 6,377 5.07% 6.55% |
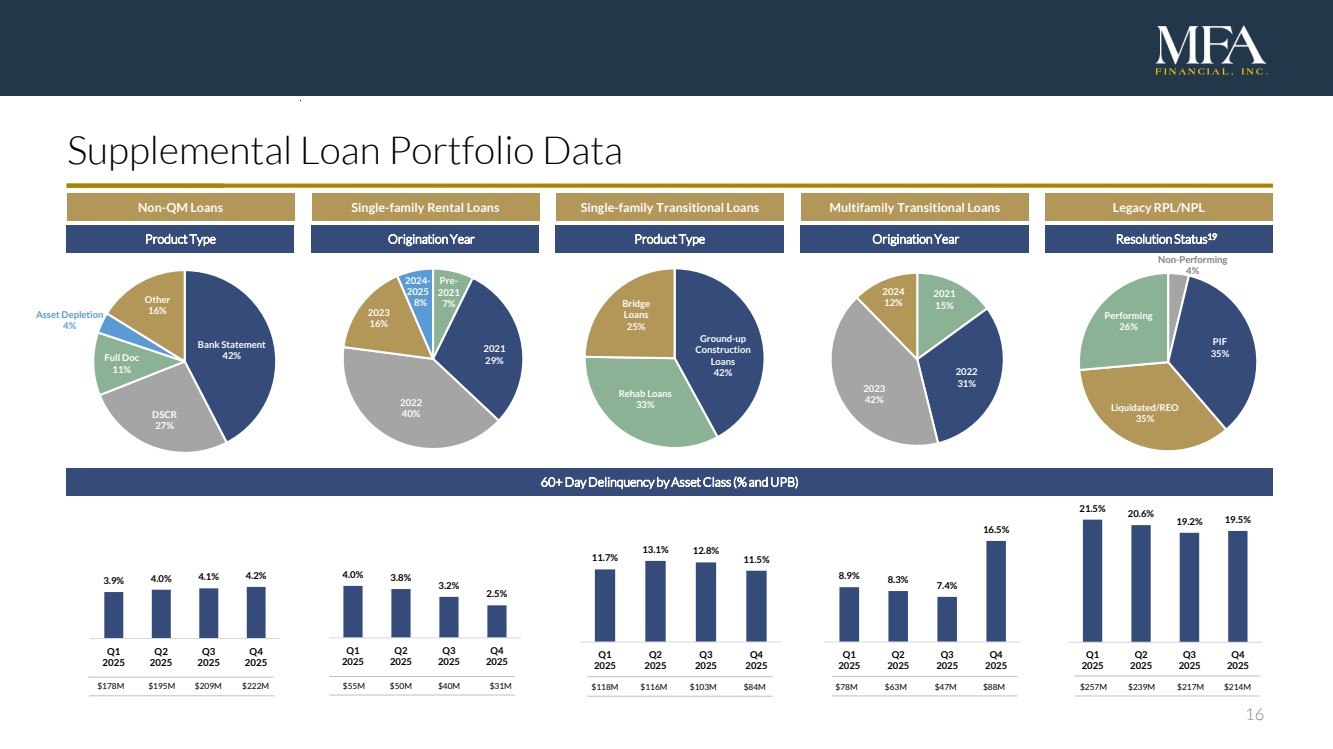
| 16 21.5% 20.6% 19.2% 19.5% Q1 2025 Q2 2025 Q3 2025 Q4 2025 8.9% 8.3% 7.4% 16.5% Q1 2025 Q2 2025 Q3 2025 Q4 2025 3.9% 4.0% 4.1% 4.2% Q1 2025 Q2 2025 Q3 2025 Q4 2025 Ground-up Construction Loans 42% Rehab Loans 33% Bridge Loans 25% Q3 2022 Financial Snapshot Supplemental Loan Portfolio Data Product Type Origination Year Product Type Origination Year 60+ Day Delinquency by Asset Class (% and UPB) Resolution Status19 Non-QM Loans Single-family Rental Loans Single-family Transitional Loans Multifamily Transitional Loans Legacy RPL/NPL $178M $195M $209M $222M $55M $50M $40M $31M $118M $116M $103M $84M $78M $63M $47M $88M $257M $239M $217M $214M Non-Performing 4% Bank Statement 42% DSCR 27% Full Doc 11% Asset Depletion 4% Other 16% PIF 35% Liquidated/REO 35% Performing 26% Pre-2021 7% 2021 29% 2022 40% 2023 16% 2024- 2025 8% 2021 15% 2022 31% 2023 42% 2024 12% 4.0% 3.8% 3.2% 2.5% Q1 2025 Q2 2025 Q3 2025 Q4 2025 11.7% 13.1% 12.8% 11.5% Q1 2025 Q2 2025 Q3 2025 Q4 2025 |
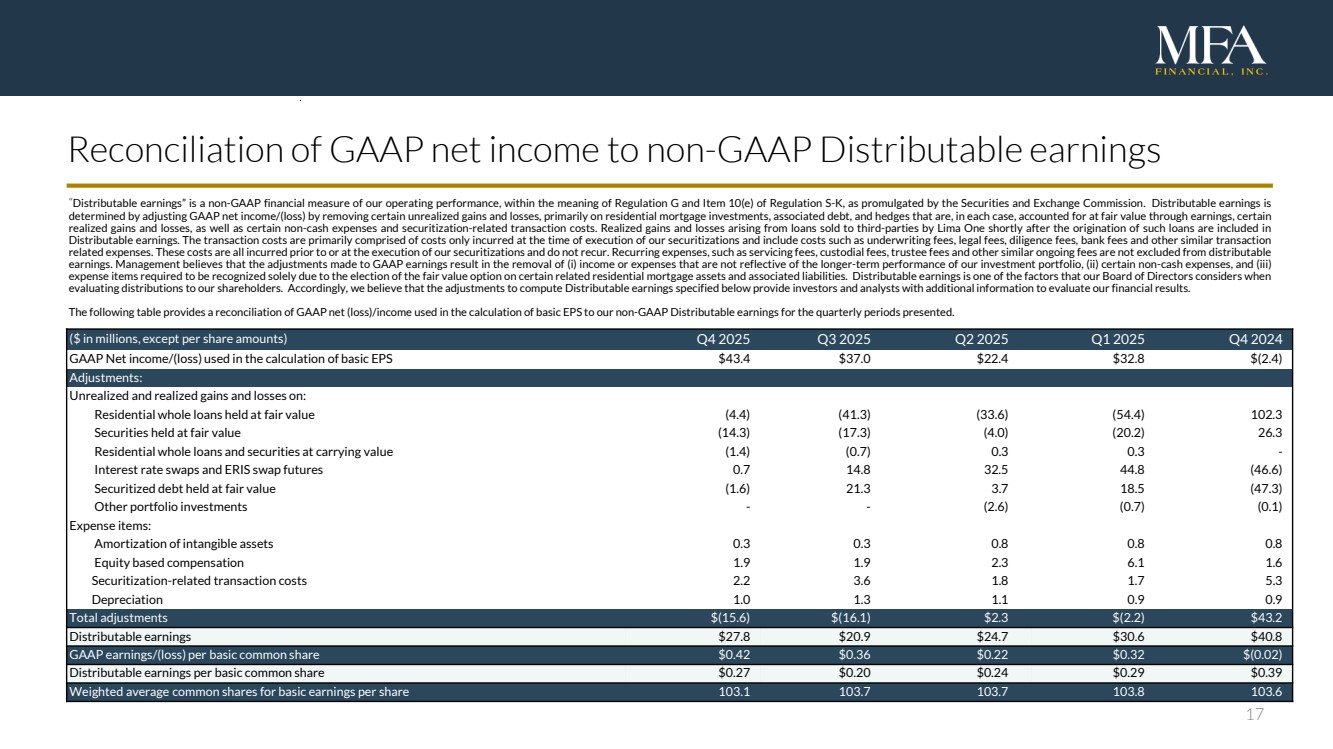
| 17 “Distributable earnings” is a non-GAAP financial measure of our operating performance, within the meaning of Regulation G and Item 10(e) of Regulation S-K, as promulgated by the Securities and Exchange Commission. Distributable earnings is determined by adjusting GAAP net income/(loss) by removing certain unrealized gains and losses, primarily on residential mortgage investments, associated debt, and hedges that are, in each case, accounted for at fair value through earnings, certain realized gains and losses, as well as certain non-cash expenses and securitization-related transaction costs. Realized gains and losses arising from loans sold to third-parties by Lima One shortly after the origination of such loans are included in Distributable earnings. The transaction costs are primarily comprised of costs only incurred at the time of execution of our securitizations and include costs such as underwriting fees, legal fees, diligence fees, bank fees and other similar transaction related expenses. These costs are all incurred prior to or at the execution of our securitizations and do not recur. Recurring expenses, such as servicing fees, custodial fees, trustee fees and other similar ongoing fees are not excluded from distributable earnings. Management believes that the adjustments made to GAAP earnings result in the removal of (i) income or expenses that are not reflective of the longer-term performance of our investment portfolio, (ii) certain non-cash expenses, and (iii) expense items required to be recognized solely due to the election of the fair value option on certain related residential mortgage assets and associated liabilities. Distributable earnings is one of the factors that our Board of Directors considers when evaluating distributions to our shareholders. Accordingly, we believe thatthe adjustments to compute Distributable earnings specified below provide investors and analysts with additional information to evaluate our financial results. The following table provides a reconciliation of GAAP net (loss)/income used in the calculation of basic EPS to our non-GAAP Distributable earnings for the quarterly periods presented. ($ in millions, except per share amounts) Q4 2025 Q3 2025 Q2 2025 Q1 2025 Q4 2024 GAAP Net income/(loss) used in the calculation of basic EPS $43.4 $37.0 $22.4 $32.8 $(2.4) Adjustments: Unrealized and realized gains and losses on: Residential whole loans held at fair value (4.4) (41.3) (33.6) (54.4) 102.3 Securities held at fair value (14.3) (17.3) (4.0) (20.2) 26.3 Residential whole loans and securities at carrying value (1.4) (0.7) 0.3 0.3 - Interest rate swaps and ERIS swap futures 0.7 14.8 32.5 44.8 (46.6) Securitized debt held at fair value (1.6) 21.3 3.7 18.5 (47.3) Other portfolio investments - - (2.6) (0.7) (0.1) Expense items: Amortization of intangible assets 0.3 0.3 0.8 0.8 0.8 Equity based compensation 1.9 1.9 2.3 6.1 1.6 Securitization-related transaction costs 2.2 3.6 1.8 1.7 5.3 Depreciation 1.0 1.3 1.1 0.9 0.9 Total adjustments $(15.6) $(16.1) $2.3 $(2.2) $43.2 Distributable earnings $27.8 $20.9 $24.7 $30.6 $40.8 GAAP earnings/(loss) per basic common share $0.42 $0.36 $0.22 $0.32 $(0.02) Distributable earnings per basic common share $0.27 $0.20 $0.24 $0.29 $0.39 Weighted average common shares for basic earnings per share 103.1 103.7 103.7 103.8 103.6 Reconciliation of GAAP net income to non-GAAP Distributable earnings |
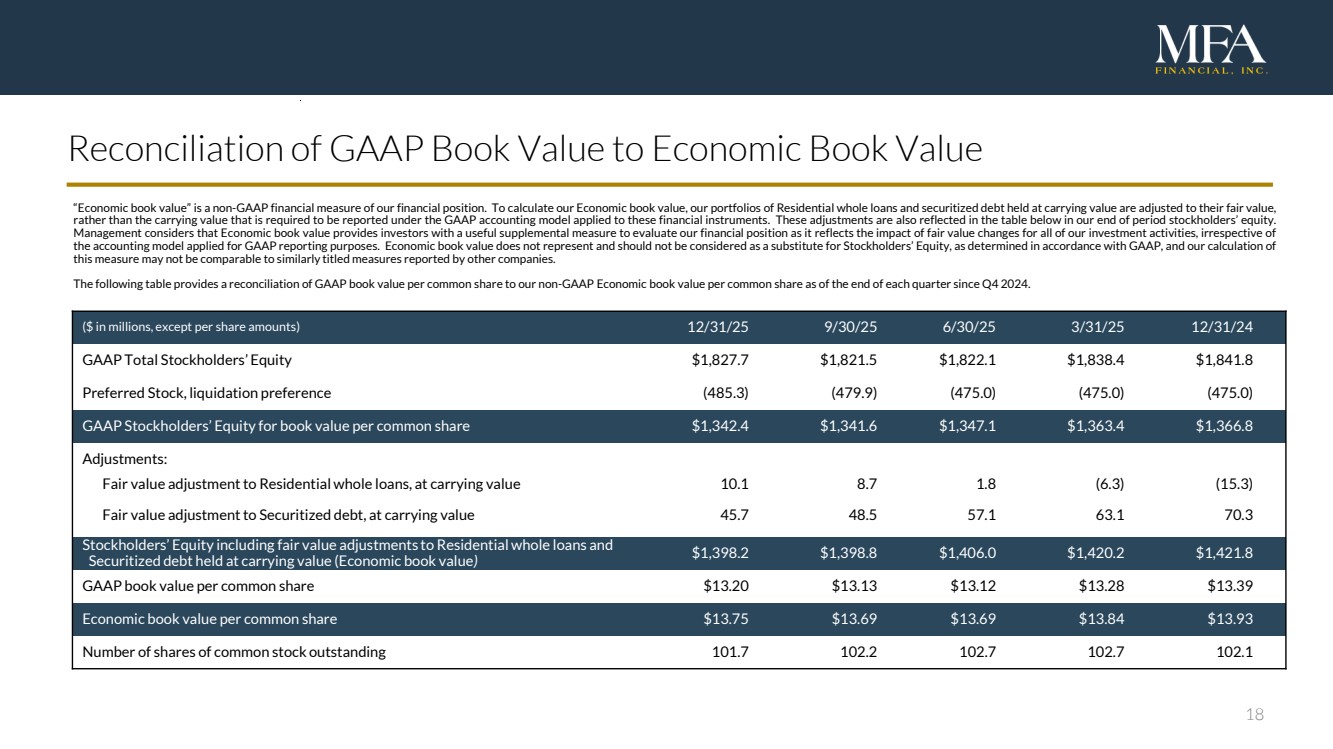
| 18 Reconciliation of GAAP Book Value to Economic Book Value “Economic book value” is a non-GAAP financial measure of our financial position. To calculate our Economic book value, our portfolios of Residential whole loans and securitized debt held at carrying value are adjusted to their fair value, rather than the carrying value that is required to be reported under the GAAP accounting model applied to these financial instruments. These adjustments are also reflected in the table below in our end of period stockholders’ equity. Management considers that Economic book value provides investors with a useful supplemental measure to evaluate our financial position as it reflects the impact of fair value changes for all of our investment activities, irrespective of the accounting model applied for GAAP reporting purposes. Economic book value does not represent and should not be considered as a substitute for Stockholders’ Equity, as determined in accordance with GAAP, and our calculation of this measure may not be comparable to similarly titled measures reported by other companies. The following table provides a reconciliation of GAAP book value per common share to our non-GAAP Economic book value per common share as of the end of each quarter since Q4 2024. ($ in millions, except per share amounts) 12/31/25 9/30/25 6/30/25 3/31/25 12/31/24 GAAP Total Stockholders’ Equity $1,827.7 $1,821.5 $1,822.1 $1,838.4 $1,841.8 Preferred Stock, liquidation preference (485.3) (479.9) (475.0) (475.0) (475.0) GAAP Stockholders’ Equity for book value per common share $1,342.4 $1,341.6 $1,347.1 $1,363.4 $1,366.8 Adjustments: Fair value adjustment to Residential whole loans, at carrying value 10.1 8.7 1.8 (6.3) (15.3) Fair value adjustment to Securitized debt, at carrying value 45.7 48.5 57.1 63.1 70.3 Stockholders’ Equity including fair value adjustments to Residential whole loans and Securitized debt held at carrying value (Economic book value) $1,398.2 $1,398.8 $1,406.0 $1,420.2 $1,421.8 GAAP book value per common share $13.20 $13.13 $13.12 $13.28 $13.39 Economic book value per common share $13.75 $13.69 $13.69 $13.84 $13.93 Number of shares of common stock outstanding 101.7 102.2 102.7 102.7 102.1 |
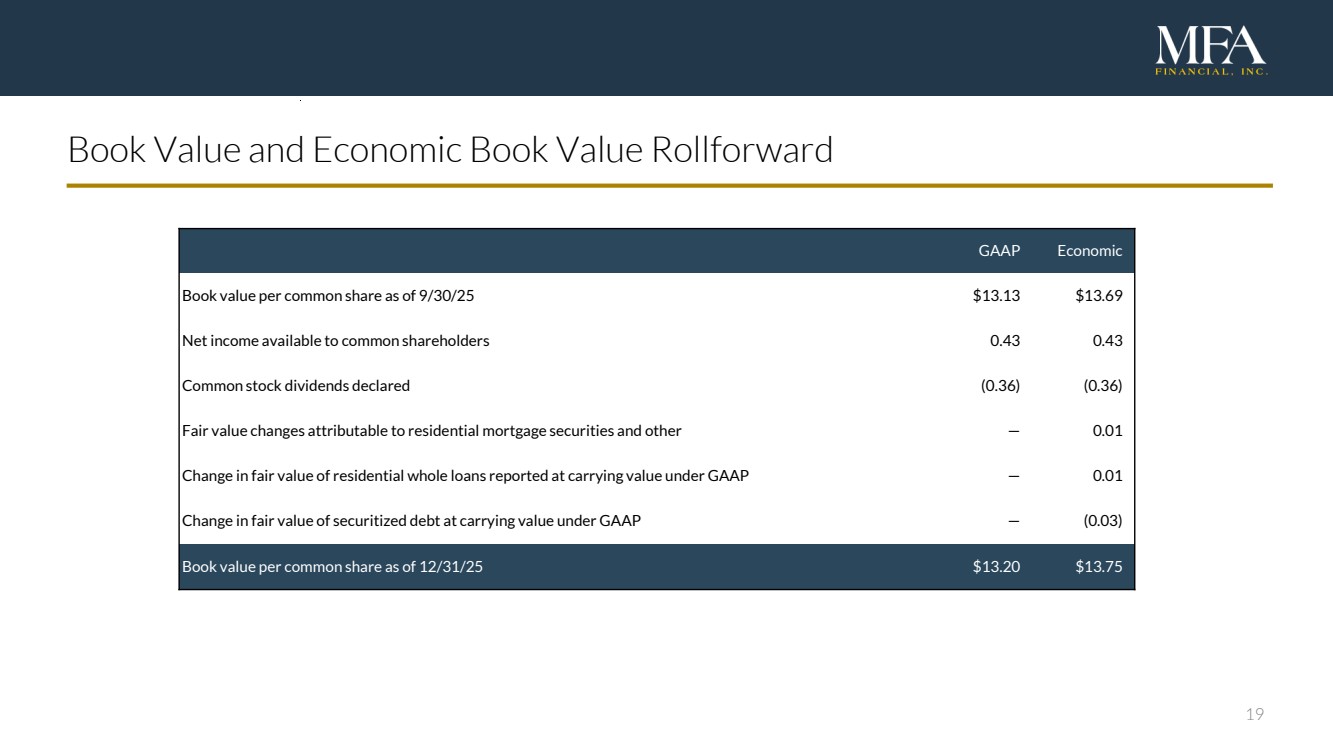
| 19 Book Value and Economic Book Value Rollforward GAAP Economic Book value per common share as of 9/30/25 $13.13 $13.69 Net income available to common shareholders 0.43 0.43 Common stock dividends declared (0.36) (0.36) Fair value changes attributable to residential mortgage securities and other — 0.01 Change in fair value of residential whole loans reported at carrying value under GAAP — 0.01 Change in fair value of securitized debt at carrying value under GAAP — (0.03) Book value per common share as of 12/31/25 $13.20 $13.75 |
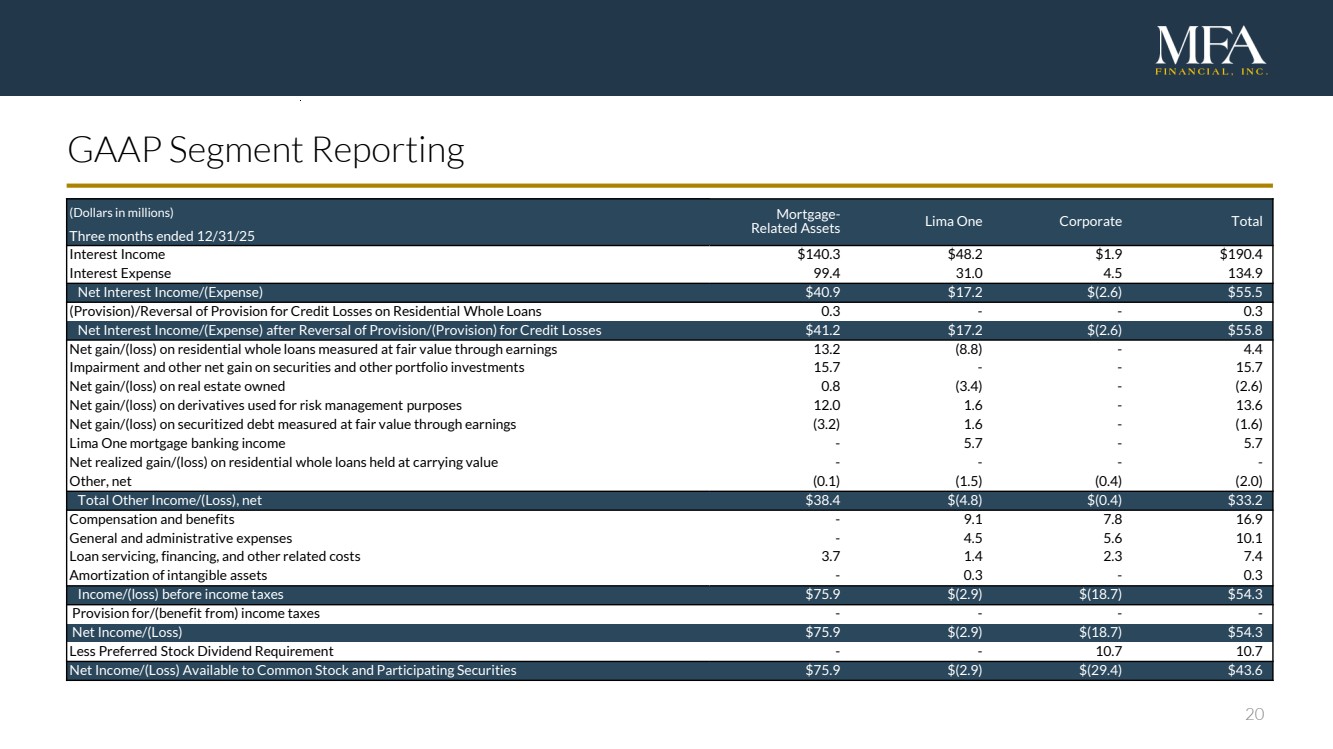
| 20 GAAP Segment Reporting (Dollars in millions) Mortgage-Related Assets Lima One Corporate Total Three months ended 12/31/25 Interest Income $140.3 $48.2 $1.9 $190.4 Interest Expense 99.4 31.0 4.5 134.9 Net Interest Income/(Expense) $40.9 $17.2 $(2.6) $55.5 (Provision)/Reversal of Provision for Credit Losses on Residential Whole Loans 0.3 - - 0.3 Net Interest Income/(Expense) after Reversal of Provision/(Provision) for Credit Losses $41.2 $17.2 $(2.6) $55.8 Net gain/(loss) on residential whole loans measured at fair value through earnings 13.2 (8.8) - 4.4 Impairment and other net gain on securities and other portfolio investments 15.7 - - 15.7 Net gain/(loss) on real estate owned 0.8 (3.4) - (2.6) Net gain/(loss) on derivatives used for risk management purposes 12.0 1.6 - 13.6 Net gain/(loss) on securitized debt measured at fair value through earnings (3.2) 1.6 - (1.6) Lima One mortgage banking income - 5.7 - 5.7 Net realized gain/(loss) on residential whole loans held at carrying value - - - - Other, net (0.1) (1.5) (0.4) (2.0) Total Other Income/(Loss), net $38.4 $(4.8) $(0.4) $33.2 Compensation and benefits - 9.1 7.8 16.9 General and administrative expenses - 4.5 5.6 10.1 Loan servicing, financing, and other related costs 3.7 1.4 2.3 7.4 Amortization of intangible assets - 0.3 - 0.3 Income/(loss) before income taxes $75.9 $(2.9) $(18.7) $54.3 Provision for/(benefit from) income taxes - - - - Net Income/(Loss) $75.9 $(2.9) $(18.7) $54.3 Less Preferred Stock Dividend Requirement - - 10.7 10.7 Net Income/(Loss) Available to Common Stock and Participating Securities $75.9 $(2.9) $(29.4) $43.6 |
| 21 Endnotes 1) Economic book value (EBV) is a non-GAAP financial measure. Refer to slide 18 for further information regarding the calculation of this measure and a reconciliation to GAAP book value. 2) Total economic return is calculated as the quarterly change in EBV plus common dividends declared during the quarter divided by EBV at the start of the quarter. 3) Recourse leverage is the ratio of MFA’s financing liabilities (excluding non-recourse debt) to net equity. Including securitized debt, MFA’s overall leverage ratio at Dec. 31, 2025 was 6.0x. 4) GAAP net income is presented per basic and diluted common share. 5) Distributable earnings is a non-GAAP financial measure. Refer to slide 17 for further information regarding the calculation of this measure and a reconciliation to GAAP net income. Distributable earnings is presented per basic common share. 6) Origination amount is based on the maximum loan amount, which includes amounts initially funded plus any committed but undrawn amounts. $145.3M of funded originations occurred during Q4 2025 and $69.5M of draws were funded during Q4 2025 on previously originated Transitional loans. 7) Amounts presented reflect the aggregation of fair value and carrying value amounts as presented in MFA’s consolidated balance sheet at Dec. 31, 2025. 8) Non-MTM refers to financing arrangements not subject to margin calls based on changes in the fair value of the financed residential whole loans. Such agreements may experience changes in advance rates or collateral eligibility due to factors such as changes in the delinquency status of the financed residential whole loans. 9) Excludes Agency-eligible investor loans, which had a fair value of $51M at Dec. 31, 2025. 10) Loan-to-value (LTV) ratio reflects principal amortization and estimated home price appreciation (or depreciation) since acquisition. Zillow Home Value Index (ZHVI) is utilized to estimate updated LTVs for Non-QM, SFR and Legacy RPL/NPL assets. For Transitional loans, LTV reflects either the current unpaid principal balance (UPB) divided by the most recent as-is property valuation available or the maximum UPB divided by the most recent after repaired value (ARV) available. 11) State concentration measured by loan balance. All states in “Other” category have concentrations below 5%. 12) CPR includes all principal repayments. 13) Balance sheet carrying value of real estate owned (REO) properties at Dec. 31, 2025. 14) Undrawn construction funds for performing Transitional loans at Dec. 31, 2025. Borrowers must be current in order to receive unfunded commitments. 15) Percentage of Transitional loan portfolios extended beyond original maturity date at Dec. 31, 2025. 16) Current coupon Agency MBS spread over blended 5Y and 10Y Treasury yields. Data sourced from Bloomberg and presented in basis points. 17) Collateral UPB includes cash for Transitional loan securitizations. 18) Bonds sold relative to certificates issued. 19) Represents status at Dec. 31, 2025 of all Legacy RPL/NPL loans ever acquired. Non-performing status includes all active loans greater than 60 days delinquent. Liquidated/REO status includes both sold and active REO properties as well as short payoff liquidations and loans sold to third-parties. |